


Car accidents in New Jersey are all too common, but dealing with the aftermath is anything but normal. You can’t do the things you used to do or move the way you used to move. You don’t feel like you anymore. As you work toward physical recovery, you need someone you can trust with you every step of the way, advocating for your well-being. You need someone who will make sure the careless actions of another driver won’t drag you down financially.
At Console & Associates, P.C., you will be represented by a New Jersey car accident lawyer dedicated to helping you get your life back on track, just as we have for thousands of clients throughout the state. Since 1994, our personal injury attorneys in New Jersey have helped injury victims near you get the justice and compensation they deserve.
Console & Associates P.C., has handled thousands of car accident claims over decades of legal practice. We can help you recover the compensation you deserve to afford medical care, make up for lost wages, and otherwise reclaim your life.
Our local car accident attorneys represent injured victims throughout New Jersey and Pennsylvania.
If you’ve been injured in a car accident call (866) 778-5500 today for a free, no-obligation consultation with an experienced legal professional at Console & Associates P.C.
There’s no warning – just a jarring impact that nothing could have braced you for. It’s not just the physical impact of the collision. It’s the way that impact spreads through your life, your physical and emotional health, and your family’s well-being. No matter how hard you try to pretend otherwise – to walk it off, to stay positive – things are different now.
That’s not a reason to lose hope. If the aftermath of a car accident is one of the most difficult times of your life, you need help like you’ve never needed it before.
Our New Jersey injury lawyers near you can offer you the help – and the hope – you need right now, with no risk and no upfront cost.
The local car accident lawyers at Console & Associates handle claims involving all types of motor vehicle collisions that result from negligence, including:
Whether a driver’s negligence or another type of breach of duty of care is to blame for your injuries, we have the experience to investigate the collision and pursue the compensation you deserve.
Rollover accidents, rear-end crashes, T-bone collisions, head-on wrecks, sideswipe accidents—our auto accident lawyers have handled them all over our decades of practicing personal injury law. Car accident cases can be complex, involving numerous liable parties and complicated chains of events, or they can be relatively straightforward. Whatever the situation, a free consultation with the car accident attorneys at Console & Associates P.C. can help you understand your legal rights and options for pursuing compensation.
Every year, 4.5 million Americans are injured in car accidents, according to the National Safety Council. Many injured victims will never receive the compensation they deserve for what they’ve lost. If you’re looking for a New Jersey dog bite attorney, we handle those types of cases as well.
– and it is an important one – but it doesn’t mean resigning yourself to some fate you can’t control. Retaining legal representation is a way for you to take back control of your life after an accident.
A New Jersey auto accident lawyer represents accident victims in court—and so much more. You need a car accident attorney to conduct a thorough car crash investigation, build a legal strategy tailored to the unique facts of your claim, and calculate the full extent of your damages.
Whether through a trial or an out-of-court settlement, an attorney has the best chance to get maximum compensation for a claimant. Accident victims with professional legal representation get 3.5 times more money, on average, according to a 2014 study by the Insurance Research Council. Some of the reasons attorneys can get clients more money is because they have the skills to identify all parties that bear legal liability for a collision and to make sure that a settlement covers all kinds of legally recognizable damages a victim sustains. If you are located in New Jersey and need a car accident lawyer in Cherry Hill, Marlton, or Newark or another nearby city, we are here to help.
You should hire an auto accident attorney for any claim that meets the following criteria:
Car accident causes are often multifaceted, and the injured person sometimes shares some real or alleged fault for the crash. An experienced, local car accident lawyer can use evidence to prove that the defendant’s negligence was the primary cause of the collision and work to minimize any liability on your part. Additionally, the lawyer can help to understand how much you may be compensated after a car accident.
Given that sharing liability for a crash tends to reduce the average car accident settlement, if it doesn’t prevent the victim from getting compensated at all, minimizing liability is important.

Some of the parties that can be found to hold car accident legal liability may include:
Although they aren’t accused of negligence, insurance companies for defendants like those described above hold car accident responsibility in a financial sense. Most car accident settlements are paid by auto insurance companies. This fact is particularly good news for auto accident victims, like passengers, who may have to sue a friend to get compensation for their car accident injuries and losses. If you’re looking for a New Jersey truck accident lawyer or car accident lawyer in Marlton, NJ, please contact our office today.
Our New Jersey car accident legal team is dedicated to helping you with every aspect of your claim. We’ll work hard to ensure you get the maximum settlement possible for your case. Some of the ways we can help with your car accident claim include:
At Console and Associates, P.C., we have an outstanding record of success over our 25 years of practice, regularly recovering maximum compensation for victims like you involved in car accidents. With thousands of satisfied clients throughout NJ – North, South, and Central – and more than $100 million recovered, we have the skills to win your case and the results to prove it. In addition, our attorneys’ intelligence and integrity have earned them regional and national recognition in the legal community and beyond.
Our New Jersey car accident lawyers handle every motor vehicle accident claim on a no-win, no-fee basis. That’s our No Win No Fee Promise. We receive a percentage of the settlement, and if the claim is not successful, you pay nothing for attorneys’ fees. ![]()
Additionally, at Console and Associates, P.C., we advance thousands of dollars in costs for each of our client’s claims – and, for cases that are far into the litigation phase, up to tens of thousands of dollars. We’re happy to take on this burden so that our clients have the opportunity to get justice, no matter what their current financial situation is.
Fortunately, you never have to worry about coming up with the money for these expenses when you have the New Jersey car accident lawyers at Console and Associates on your side.
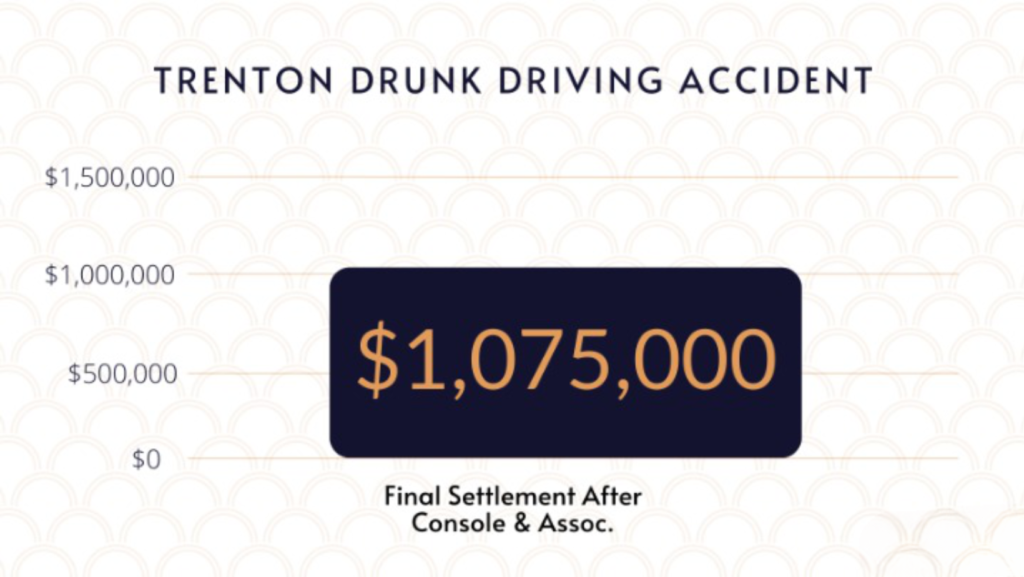
Proven results are the single most important factor you need to consider when you choose a law firm – and we’ve got the results you’re looking for, including numerous six-figure settlements and jury awards, including:
Unfortunately, there’s no simple settlement calculator where you can plug in a few numbers and come up with a dollar amount. How much your car accident case is worth depends on a number of factors, some of which you have no control over. The best way to determine how much your case is worth is by speaking with an experienced
New Jersey car accident lawyer
. We have examples of individuals who have attained recent settlements from rear-end accidents, and herniated discs.
At Console & Associates, P.C., we will use the details of your case to help you get a better idea of how much your case is worth.
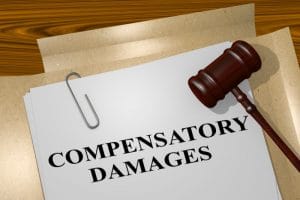
Your damages encompass all of the harms that have resulted from your accident. There are two types of damages recognized in the legal world: economic and non-economic.
Economic damages: are any damages you can put a numeric, quantifiable price on, including:
Non-economic damages: are damages that aren’t associated with a straightforward dollar amount, such as:
Several factors impact the value of your New Jersey car accident case, including:
If you are looking for accident lawyers in South Jersey, call our office today.

Liability means that someone is legally at fault or responsible for the accident. Generally, to pursue a car accident claim in New Jersey, you must be able to prove that the other party is the one at fault for the collision. However, determining fault isn’t always a simple matter. Often, multiple factors contribute to a crash.
At times, more than one driver may be partially at fault for the collision. Under New Jersey’s comparative negligence law, you don’t have the grounds for a claim if you are more than 50 percent at fault for the collision. However, you may still be eligible to pursue some compensation if you are determined to share 50 percent – or less – of responsibility for the crash. If you are partially at fault for the collision, your compensation will be reduced by the amount you are at fault.
Proving liability for the crash requires a thorough investigation. At Console & Associates, P.C, our local car accident lawyers will conduct a separate and thorough investigation with your interests at the forefront.
Under the state’s no-fault law, you’re the one responsible for your own medical bills – not the driver who caused the crash.
No-fault laws don’t mean that no one is at fault. Instead, no-fault laws require the insurance company of each person injured in the accident to pay for their own policyholder’s medical costs, regardless of fault.
No-fault insurance coverage allows you to get your medical claim set up faster, so you aren’t waiting for the insurance companies to decide who is at fault before you can start getting your medical bills paid.
Basic and standard auto insurance policies sold in New Jersey must comply with the no-fault law. This means they must include a section of coverage known as personal injury protection or PIP. New Jersey PIP insurance covers your medical bills after a crash.
When you buy auto insurance, you purchase an amount of PIP coverage. PIP only covers your medical costs up to the limits of your policy. Most drivers on a standard policy purchase $250,000 in PIP coverage, according to the official New Jersey Auto Insurance Buyer’s Guide. However, some drivers reduce their PIP coverage to as low as $15,000 to save on their premium costs.
When you purchase auto insurance, you also select whether PIP or your health insurance is the primary policy that will cover your medical expenses. It’s always best to choose PIP as primary. This is because once you exhaust your limited PIP coverage, your health insurance has to pay for your medical care. If you select health insurance as primary, all of the PIP coverage you purchased goes to waste because you can never use it. Further, health insurance tends to charge higher deductibles, co-pays, and coinsurance than auto insurers are allowed to charge, and the health insurance company may limit you to a specific network of doctors.

Car Accident Lawyer Woman With Head Injury
In New Jersey, your PIP coverage is responsible for your medical expenses, including:
You probably don’t know offhand what selections you made on your auto insurance, and you may not fully understand these choices. Our car accident attorneys can interpret your insurance policy for you and help you understand what you’re benefits entitled to through your own policy, as well as what compensation you deserve from the other driver’s policy.
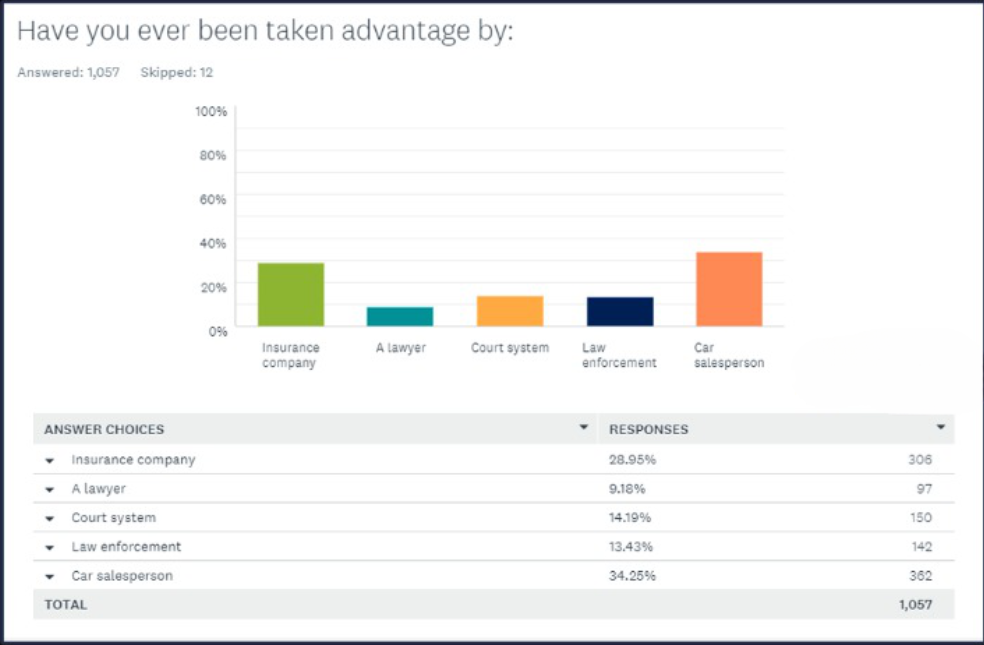
The insurance company isn’t on your side – not by a long shot. On the contrary, the insurer’s goals directly oppose yours from the get-go. In fact, almost 30 percent of people – not just car accident victims, but people over a wide range of demographic data and life experiences – reported that they had been taken advantage of by an insurance company.
At Console & Associates, P.C,
an experience New Jersey car accident attorney can help you with various issues when dealing with the insurance company after a crash. We’ll ensure you are treated fairly and get the compensation you deserve.
Insurance companies deny genuine claims for all sorts of questionable reasons. Therefore, perseverance is a must when dealing with an insurance company. Some of the most common reasons the insurance company may deny your claim include:
You do not have to accept a denial. Our car accident legal team will insist that insurers treat you fairly and call them on any behaviors that constitute bad faith to policyholders or unlawful treatment of claimants. Our New Jersey insurance bad faith lawyers will fight for your rights and refuse to back down.
If you’re getting the runaround, constantly being told that you must fill out new forms, or waiting increasingly longer times for return phone calls, it might not be your imagination. The insurance company is, perhaps deliberately, delaying your claim.
Insurance companies make money off of the premiums they charge their policyholders, so it may come as no surprise that these companies are reluctant to pay out claims like yours. Additionally, insurers invest that money they collect from policyholders to keep their profits growing. So just holding onto that money a little longer benefits the insurance company.
At Console & Associates, P.C., our local car accident lawyers will ensure the insurer doesn’t delay your claim and cause you to postpone medical care or fall behind on bills. We know how to deal with the insurance company and fight for your rights at every stage.

Faced with the certainty that the claimant deserves a large settlement and is likely to get it, the insurance company may do an about-face and pressure the claimant to accept a settlement offer right away instead of dragging out a claim.
Getting your money fast sounds great, at first. However, you need adequate compensation to move forward with your life after an accident. Often, these offers come long before you have finished your medical treatment.
When you accept a lowball insurance settlement, you sign away your right to pursue compensation for the accident in the future. So before you accept a settlement from the insurance company, speak with our New Jersey car accident lawyers to make sure you protect your ability to recover the compensation you need for recovery.
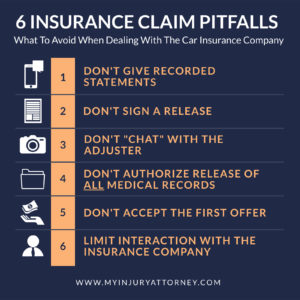
There are several things you should not do when dealing with the insurance company after an accident.
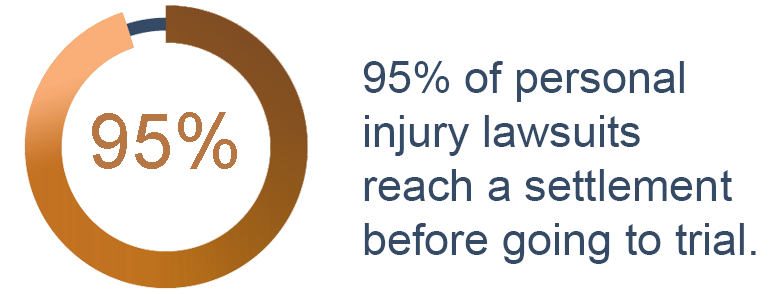
Most New Jersey car accident claims settle out of court. However, you may need to go to trial if you cannot reach a settlement with the insurance company. Fortunately, according to the federal Bureau of Justice Statistics, 65% of plaintiffs involved in car accidents prevail over the defendants they sue in court.
If your only experience with the courtroom is through the trials that appear on television and in movies, it’s no wonder that you are hesitant to put yourself and your family through this ordeal. Trials seem chaotic, risky, and nerve-wracking.
At Console & Associates, P.C, our local car accident lawyers prepare your case as though it is going to trial from the start. Additionally, we will give you straightforward advice on pursuing your claim in court. But, ultimately, the decision to go to court is yours as the plaintiff.
A common concern drivers have is that they will inadvertently cause their auto insurance rates to increase by filing a claim arising from one accident. When you get into what’s called a “chargeable” accident – generally, a crash in which you were at fault – the insurance company may choose to raise your premiums. This is true whether or not someone involved in that accident pursues a claim.
If the other driver was at fault for the accident, your premium rates shouldn’t increase. If a driver does see a rate increase resulting from a chargeable accident, filing a claim won’t have any bearing on this rate increase.
A lawyer represents you and advocates for your best interests. Additionally, lawyers get their clients more money – a lot more. Statistically, the difference amounts to, on average, 3.5 times what unrepresented claimants get for themselves in a settlement negotiation.
Your attorney also saves you time and the hassle of dealing with the back and forth with the insurance company. Therefore, in many New Jersey car accident cases, it is worth it to hire a lawyer.
It’s never too soon after an accident to take the first step of speaking with a lawyer. Even if you have not reported the car accident, it’s never too early to learn about your options. Additionally, you can call a lawyer at any time during your case for help.
Getting compensation for your claim is a process. It takes time, in part, because you don’t want to agree to a settlement amount until you are far enough along in your recovery to know how much your medical treatment will cost you and how much work you are likely to miss.
How quickly you can expect a settlement depends on the facts of your case:
Damages Breaking Down A Personal Injury Settlement
Your actions can affect the success of any personal injury claim you may pursue. Here are some of the things you definitely shouldn’t do after a car accident:
Many states (12, as of 2021) have no-fault auto accident insurance laws on the books today. Generally, these laws mean that the insurance companies covering each driver involved in an accident are responsible for paying for certain damages—typically medical care—arising from a collision, no matter who is at fault. Even if one driver was clearly in the wrong, both drivers would have their medical bills covered by their own auto insurance companies.
No-fault laws allow injured victims to begin getting medical care right away, even if fault for a crash hasn’t been determined. However, if you get seriously hurt in a no-fault state, you may still need to sue the other driver for damages that no-fault auto insurance coverage, such as personal injury protection (PIP), won’t cover.
Another instance when you might seek compensation for accident-related damages through your own insurance policy is when the driver who hit you was uninsured or underinsured. If your auto insurance policy includes uninsured motorist (UM) or underinsured motorist (UIM) coverage, then your own insurer would stand in for the other driver’s insurer and would be responsible for paying your damages, up to your coverage limits.
Yes, hiring car accident legal help is worth it. Not only do attorneys get their clients 3.5 times more money, on average, than unrepresented claimants get for themselves, but the best car accident lawyers also make the claims process easier on their clients. When you’re already struggling to deal with injuries and the financial burden of an accident,having someone else pursue a car accident lawsuit or handle these hassles for you is priceless.
People injured in car accidents often want to know about “average” or “typical” settlements, but a settlement is always based on damages, which are unique to your injuries and the facts of your accident. For example, the average settlement for car accident head injury or back and neck injuries matters is much higher for claimants who required surgery than for those who were successfully treated with more conservative methods.
What we can tell you is that our attorneys have a long history of fighting for the maximum amount of compensation our clients involved in car accidents deserve and have recovered more than $100 million for our clients.
When selecting an attorney for your auto accident claim, look at their case results, their commitment to your recovery, and what their clients say.
Take a look at what some of our happy Marlton clients have to say:
“I would like to personally thank Console & Associates for being an absolutely amazing law firm and helping me with my car accident lawsuit. They have been extremely helpful walking me thru all the steps involved and explaining and answering all my questions, of which i have had a great many. This being my first injury due to a car accident they have gone above and beyond in my opinion in all aspects. Not to mention Allison has been my main point of contact throughout most of the process and has always responded quickly and kindly to my constant deluge of emails. I can’t thank her enough!!”
Richard Santora, April 4, 2021, Rating: 5/5 ⭐⭐⭐⭐⭐
We have a 4.7 average and 126 reviews on Google
Source: www.state.nj.us/
We’ve seen firsthand what a difference it makes to families affected by a car accident to have help, support, and a reason to believe that things will get better, even in the most challenging moments. Our New Jersey car accident attorneys are here to help provide that support as we serve as your partners in your pursuit of the compensation you deserve.
Your case evaluation is free, no matter what. If you choose to move forward with a claim, there’s no cost until we get results. So there really is no risk.
Give us the chance to help you. All it takes is a phone call. Call (866) 806-3125 for your free, private consultation.
1 Holtec Drive, #100
Marlton, NJ 08053
(856) 778-5500
494 Broad St #208b
Newark, NJ 07102
(862) 229-1137


